Risk Insights
We know how important it is for our customers to see dashboards that are accurate, informative, and actionable for everyone from the CISO to the daily user.
As a result, we have made some improvements to Risk Insights. Customers will now see two dashboards: Risk Metrics and Program Metrics.
Overview
Risk Metrics are based solely on your organization’s population of Onboarded relationships. These reports provide insight into your organization's cyber risk exposure through its relationships.
Program Metrics are based on your organization’s entire relationship population (onboarded, not onboarded, and deleted). These reports are actionable by our power users and help customers better understand VISO's impact.
Clicking any of the number reports (does not include %) on Risk Metrics or Program Metrics dashboards will open a filtered view of your Relationships list page. With this added functionality, we have removed the relationship list report from the dashboard view.
If a report does not follow a particular filter or requires additional explanation, we have included help text via an (i) icon.
Filters & Reports
The following tables provide further details on the filters and reports available on each dashboard.
Filters
Filter Name | Description |
Created Date | Use this filter to apply a variety of date ranges related to the relationship created date |
Business Units | Use this filter to show only relationships associated with a specific business unit |
Risk Levels | Use this filter to show relationships with only a certain level of residual or potential risk |
Business Case | Use this filter to show relationships only associated with one or more selected business case(s) |
Data Types | Use this filter to show relationships with one or more selected Data Type(s) in scope |
Tags | Use this filter to show relationships with one or more selected custom Tag(s) applied |
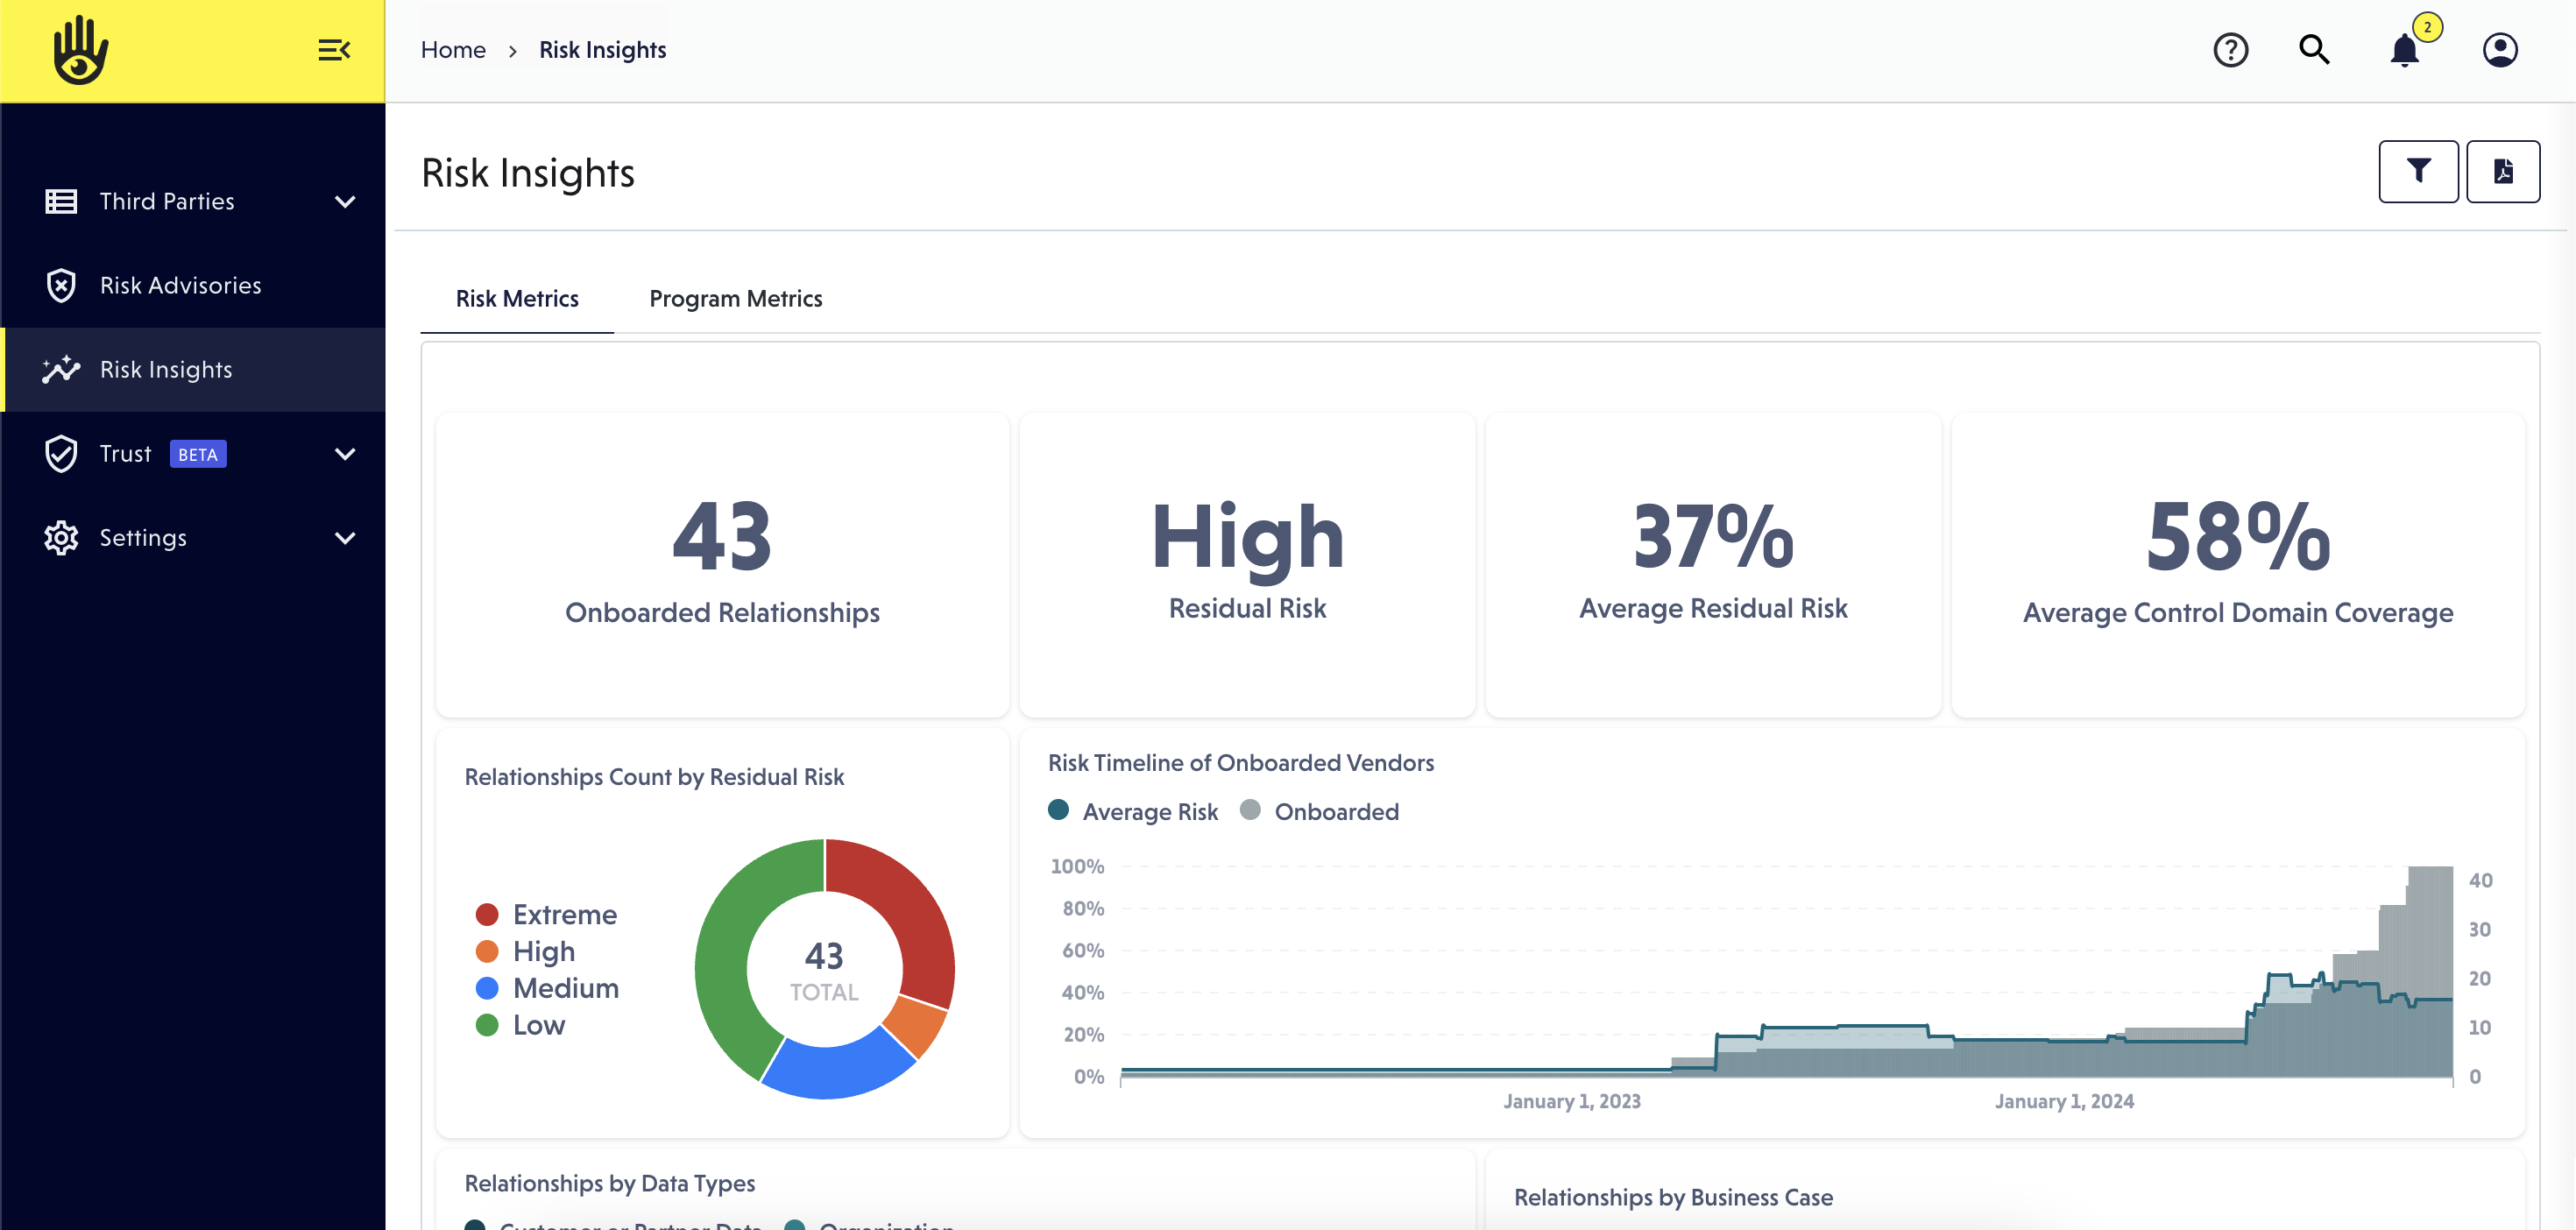
Risk Metrics Reports
The scope of these reports is Onboarded relationships only.
Report Name | Description |
Onboarded Relationships | The total count of onboarded relationships. Clicking this report will take the user to a view of the Relationship List Page with filters applied |
Average Residual Risk | The average residual risk of onboarded relationships |
Risk Timeline of Onboarded Vendors | The average organizational risk over time relative to the number of onboarded relationships in your program |
Average Control Coverage | The average percent control coverage (present controls divided by in-scope controls) across all onboarded vendors. Relationships with greater control coverage have effectively implemented more controls to mitigate risk |
Percentage of Relationships with a Comprehensive Audit Artifact | The percentage of onboarded relationships with a comprehensive audit artifact type. These artifacts have either standard or advanced levels of assurance and suggest an organizational focus on information security |
Relationships Count by Residual Risk | The number of onboarded relationships by residual risk |
Relationships by Risk per Business Unit | The number of onboarded relationships by business unit broken down by risk |
Relationships by Data Types | The number of onboarded relationships by Data Type. Data Types are grouped by Company and Customer or Partner |
Relationships by Business Case | The number of onboarded relationships by Business Case |
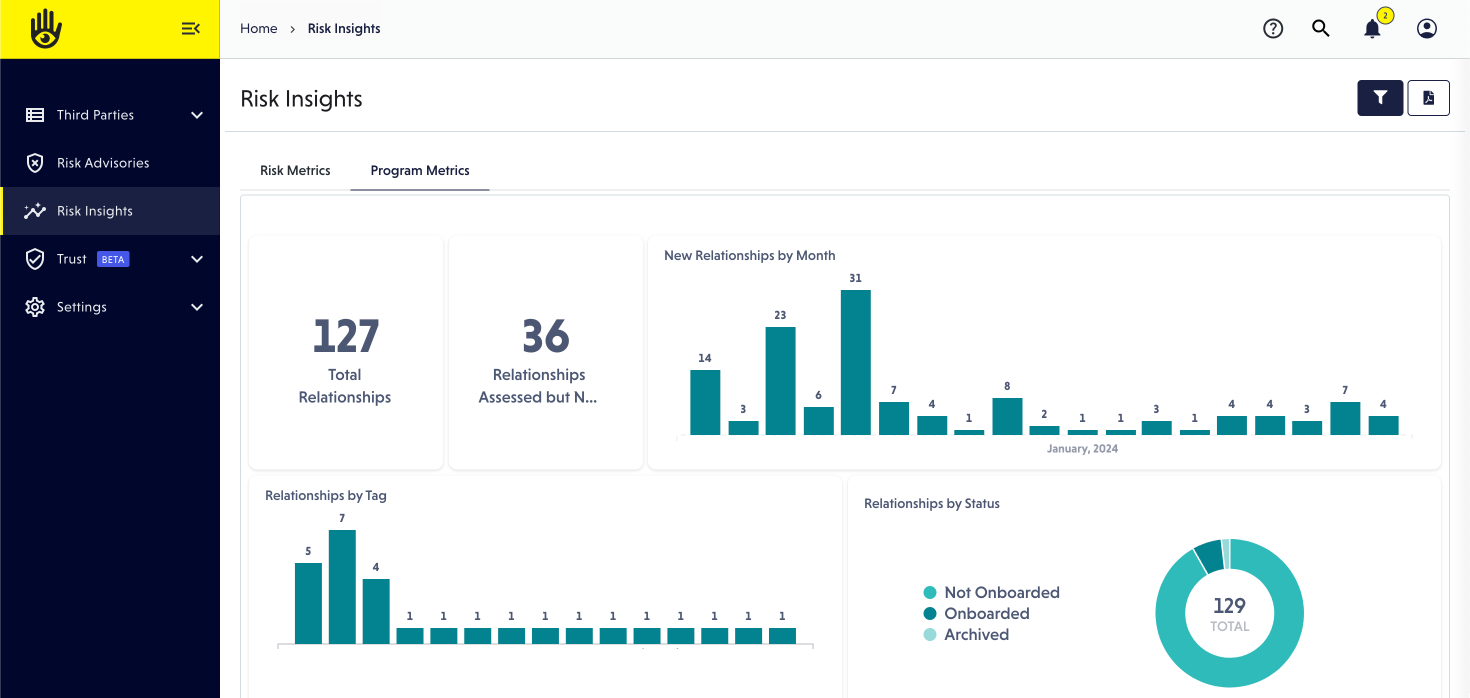
Program Metrics Reports
The scope of these reports is All Relationships (onboarded, not onboarded, deleted).
Report Name | Description |
Total Relationships | The total number of relationships including Onboarded and Not Onboarded vendors. Clicking this report will take the user to a view of the Relationship List Page with filters applied |
Relationships Assessed but Not Onboarded | The total number of Vendors with a completed assessment but have a status of Not Onboarded. Clicking this report will take the user to a view of the Relationship List Page with filters applied |
New Relationships by Month | The number of new relationships created each month |
Relationships by Tag | The number of relationships associated with each Tag |
Relationships by Status | The number of relationships by status including Onboarded, Not Onboarded, and Deleted |
Total Completed Assessments | The total number of completed assessments. Clicking this report will take the user to a view of the Relationship List Page with filters applied |
Overdue Recertifications | The total number of overdue recertifications. Clicking this report will take the user to a view of the Relationship List Page with filters applied |
Upcoming Reminders Only Recertifications | The number of relationships with a recertification within the next 30 days requiring user input. Clicking this report will take the user to a view of the Relationship List Page with filters applied |
Relationships by Recertification Type | The number of relationships by Recertification type. Only Onboarded relationships can be set to automatic recertification |
Assessments Started by Month | The number of assessments started by month across all relationships |
Completed Artifact Validations by Month | The number of artifact validations per month completed by VISO Trust |